
Today we’re publishing an exciting new and original infographic detailing the healthiest states in America – take a look!
You’re more than welcome to share this infographic on your own website – we just ask that you link back to this original post and credit us. Thanks!
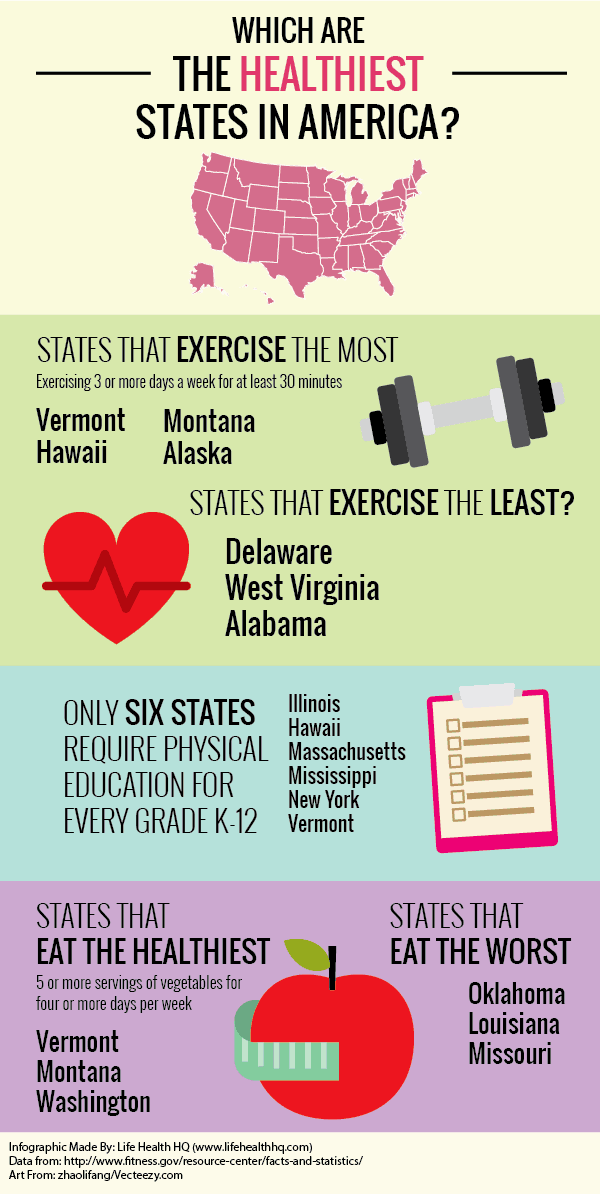
For this healthiest states in America infographic, we explored two major factors – exercise and healthy eating.
Exercise Data: Which States Exercise The Most?
Data was taken from a 2013 study by the President’s Council on Fitness, Sports & Nutrition. This study explored in which states adults were most likely to report exercising 3 or more days each week for at least 30 minutes.
The states with the most adults reporting exercise were:
- Vermont (65.3%)
- Hawaii (62.2%)
- Montana (60.1%)
- Alaska (60.1%)
Unsurprisingly, these states are known for their vast array of outdoor activities.
The states with the lowest percent of adults reporting exercise were:
- Delaware (46.5%)
- West Virginia (47.1%)
- Alabama (47.5%)
The national average for regular exercise is 51.6%
Healthy Eating Data: Which States Eat the Healthiest?
In the same 2013 study, residents of various states were asked to report on healthy eating.
Note: The percent is the amount of adults reporting healthy eating, as defined by eating 5 or more servings of vegetables on four or more days per week.
The states that eat the most healthy are:
- Vermont (68.7%)
- Montana (63.0%)
- Washington (61.8%)
The least healthy eaters are:
- Oklahoma (52.3%)
- Louisiana (53.3%)
- Missouri (53.8%).
The national average for healthy eating is 57.7%.
Other Health and Fitness Data
Other interesting data points from the President’s Council on Fitness, Sports & Nutrition:
- Only one in three children are physically active every day.
- Less than 5% of adults participate in 30 minutes of physical activity each day; only one in three adults receive the recommended amount of physical activity each week.
- More than 80% of adults do not meet the guidelines for oth aerobic and muscle-strengthening activities.
- More than 23 million Americans, including 6.5 million children, live in food deserts – areas that are more than a mile away from a supermarket.
- Empty calories from added sugars and solid fats contribute to 40% of total daily calories for 2–18 year olds and half of these empty calories come from six sources: soda, fruit drinks, dairy desserts, grain desserts, pizza, and whole milk.
- Data from 2009-2010 indicates that over 78 million U.S. adults and about 12.5 million (16.9%) children and adolescents are obese.
- Recent reports project that by 2030, half of all adults (115 million adults) in the United States will be obese.
Were you surprised to see which states were the healthiest and unhealthiest? Share your thoughts in the comments!